How to profile a .NET MAUI iOS application on macOS

In this post, I am showing the steps needed to profile a .NET MAUI iOS application on macOS. We will not use any IDE, just the terminal, utilizing the dotnet-trace global tool. While you can try to follow just the docs, here is how I got it running on several Macs.
Install .NET global tools
First, we need to install these .NET global tools:
latest .NET SDK (https://dotnet.microsoft.com/en-us/download){:target=”_blank”}
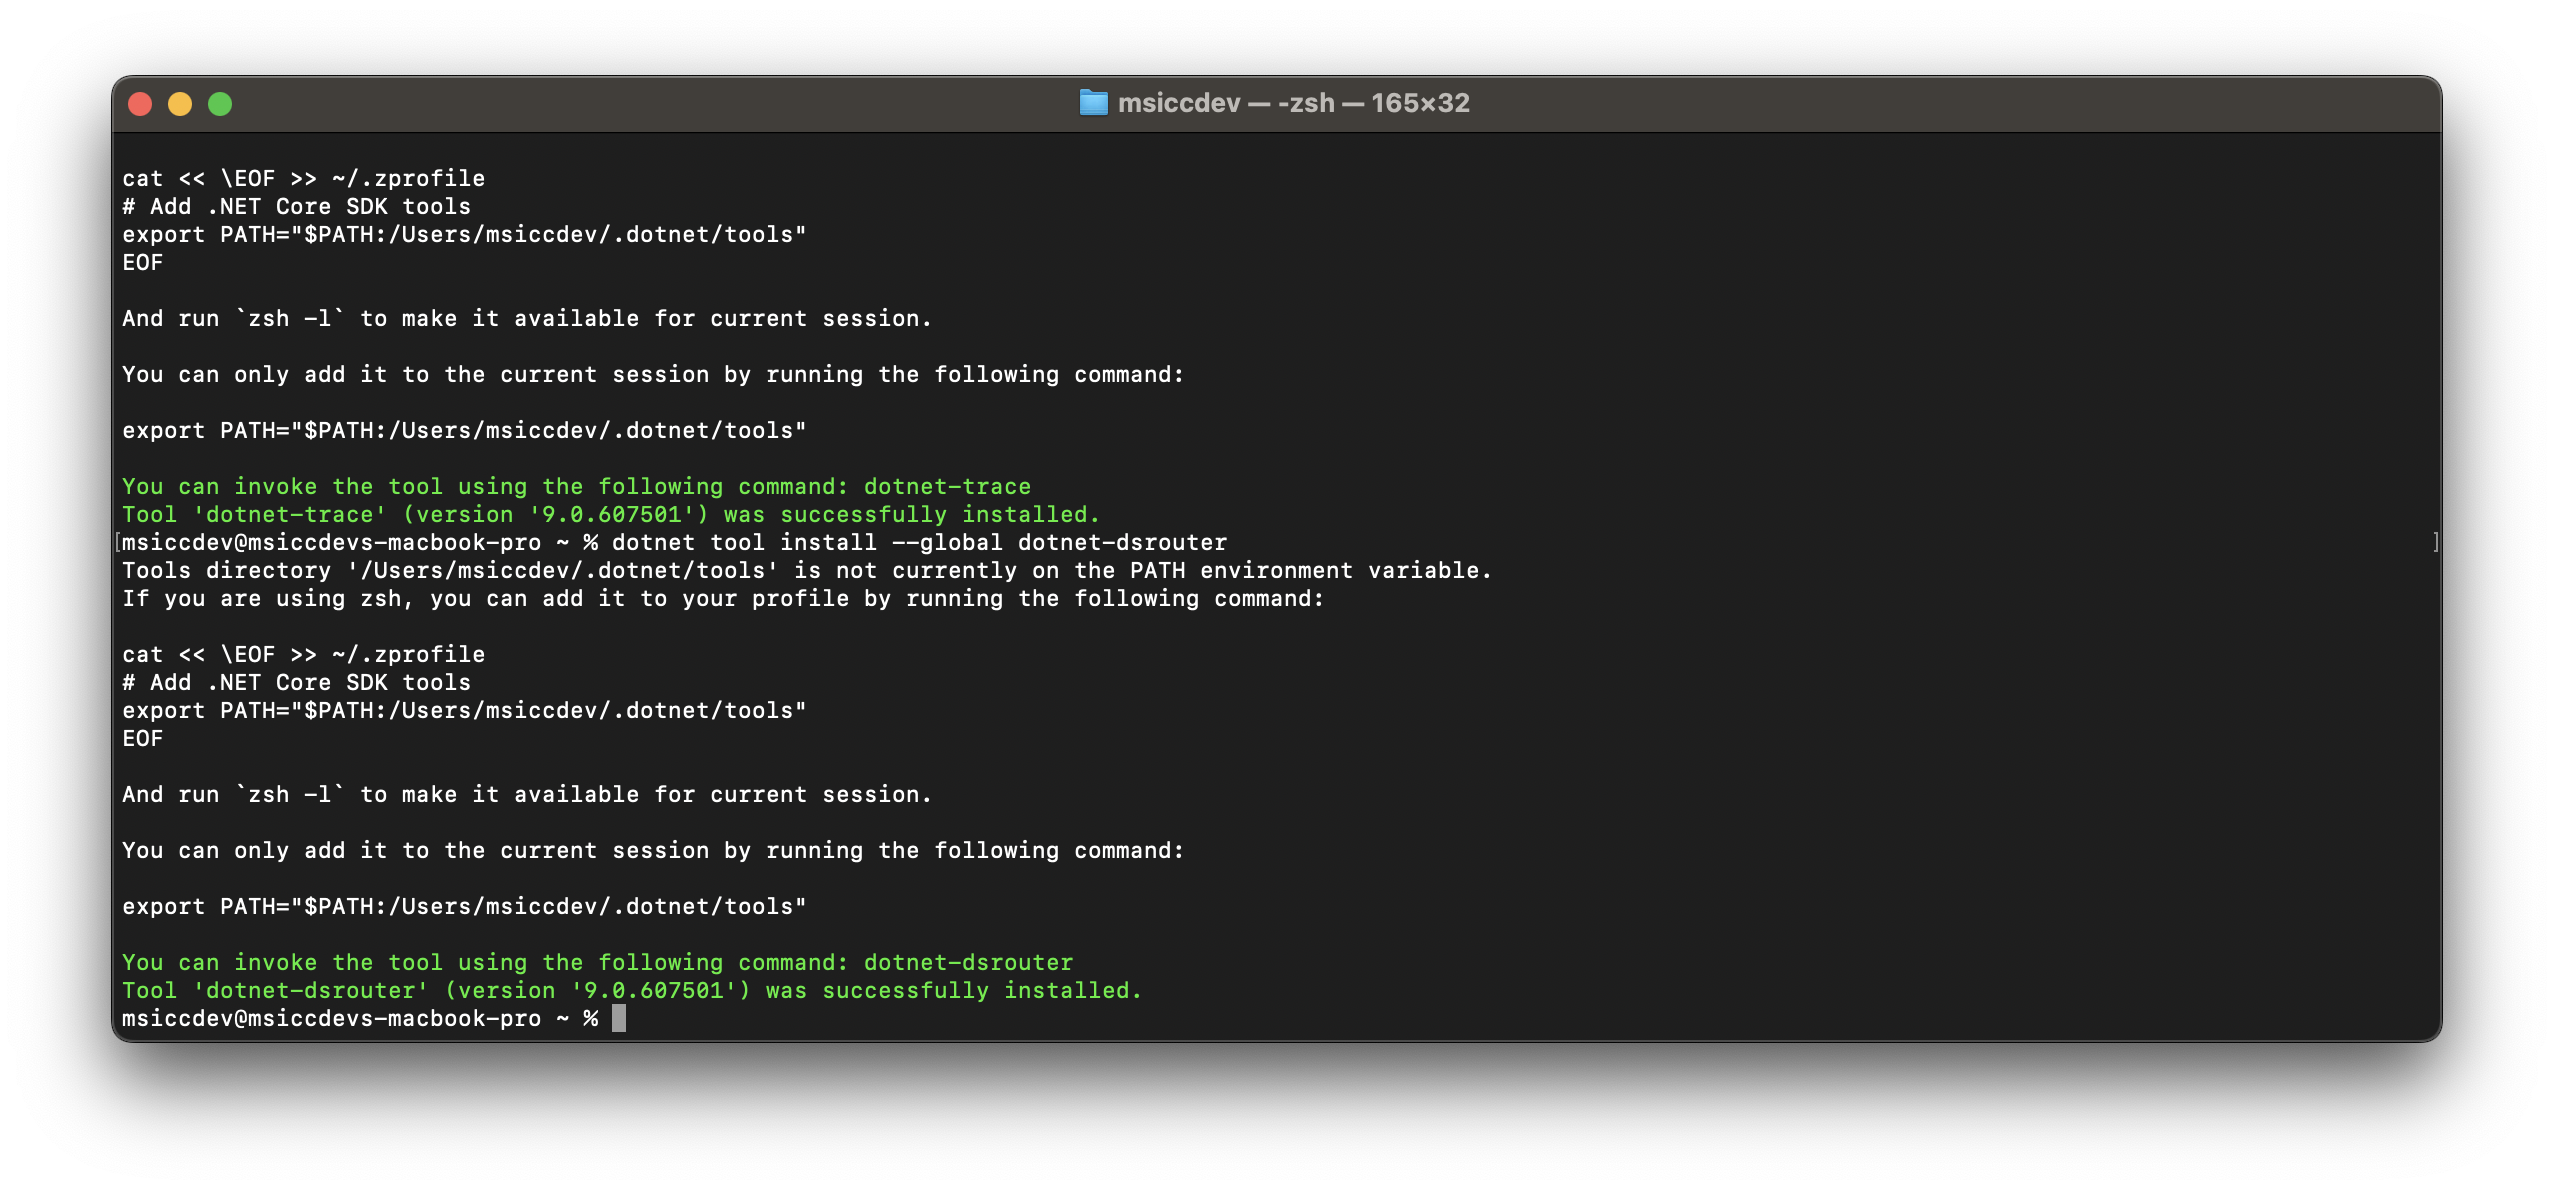
dotnet-trace: open a terminal and enter the following command (this will also update existing installations):
1
dotnet tool install --global dotnet-trace
- dotnet-dsrouter: enter the following command to enable the router for communication between macOS and iOS:
1
dotnet tool install --global dotnet-dsrouter
Prepare the application
In the .csproj file of your MAUI application, add the following property:
1
2
3
<PropertyGroup Label="Enable Diagnostic Tools" Condition="'$(Configuration)|$(Platform)'=='Debug|AnyCPU'">
    <EnableDiagnostics>true</EnableDiagnostics>
</PropertyGroup>
Please note that you should not activate AOT or Trimming for the DEBUG configuration.
Attach to the device
To connect to your device, we need to start the dsrouter with the follwoing command:
1
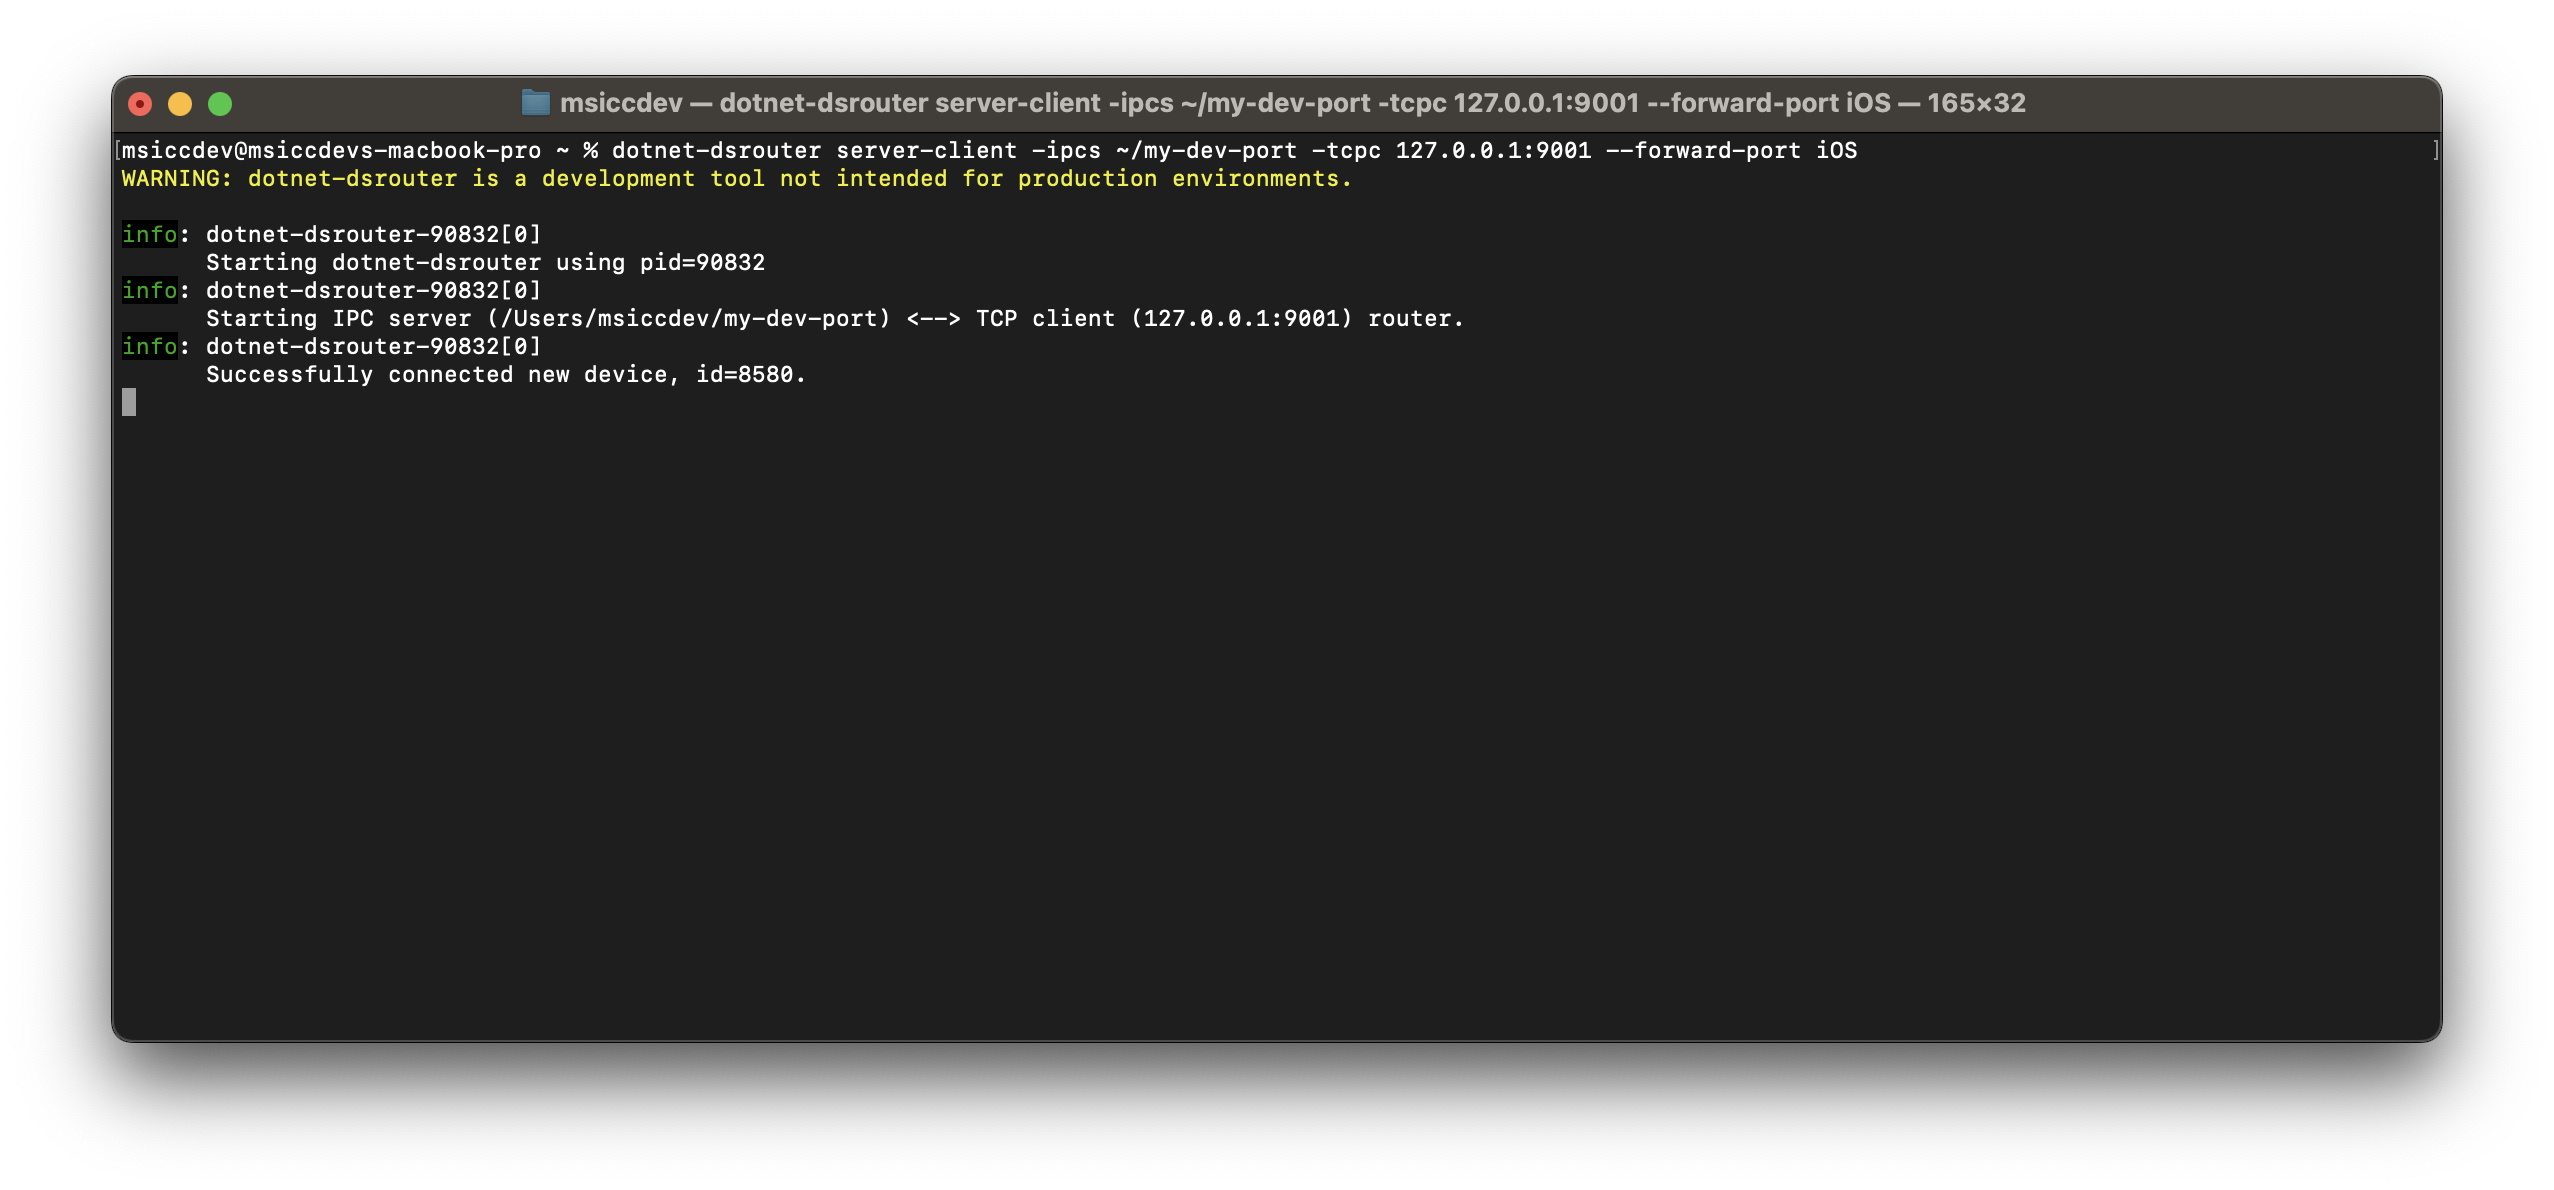
dotnet-dsrouter server-client -ipcs ~/my-dev-port -tcpc 127.0.0.1:9001 --forward-port iOS
This should result in something similar like this:
Attention: Do never close this terminal window without properly ending the tool with
CMD+C. You will block the Unix domain socket for further use, if you do. The only way to unblock the socket again is with a forced removal of the socket file (sudo rm ~/my-dev-port), which will remain as a zombie file on your mac otherwise.
Leave this terminal window as is and open two additional terminal window (CMD + N). In one of the two, we are going to reinstall the app to make sure we have the DEBUG build on the device. If you do not know the device name, just run this command first:
1
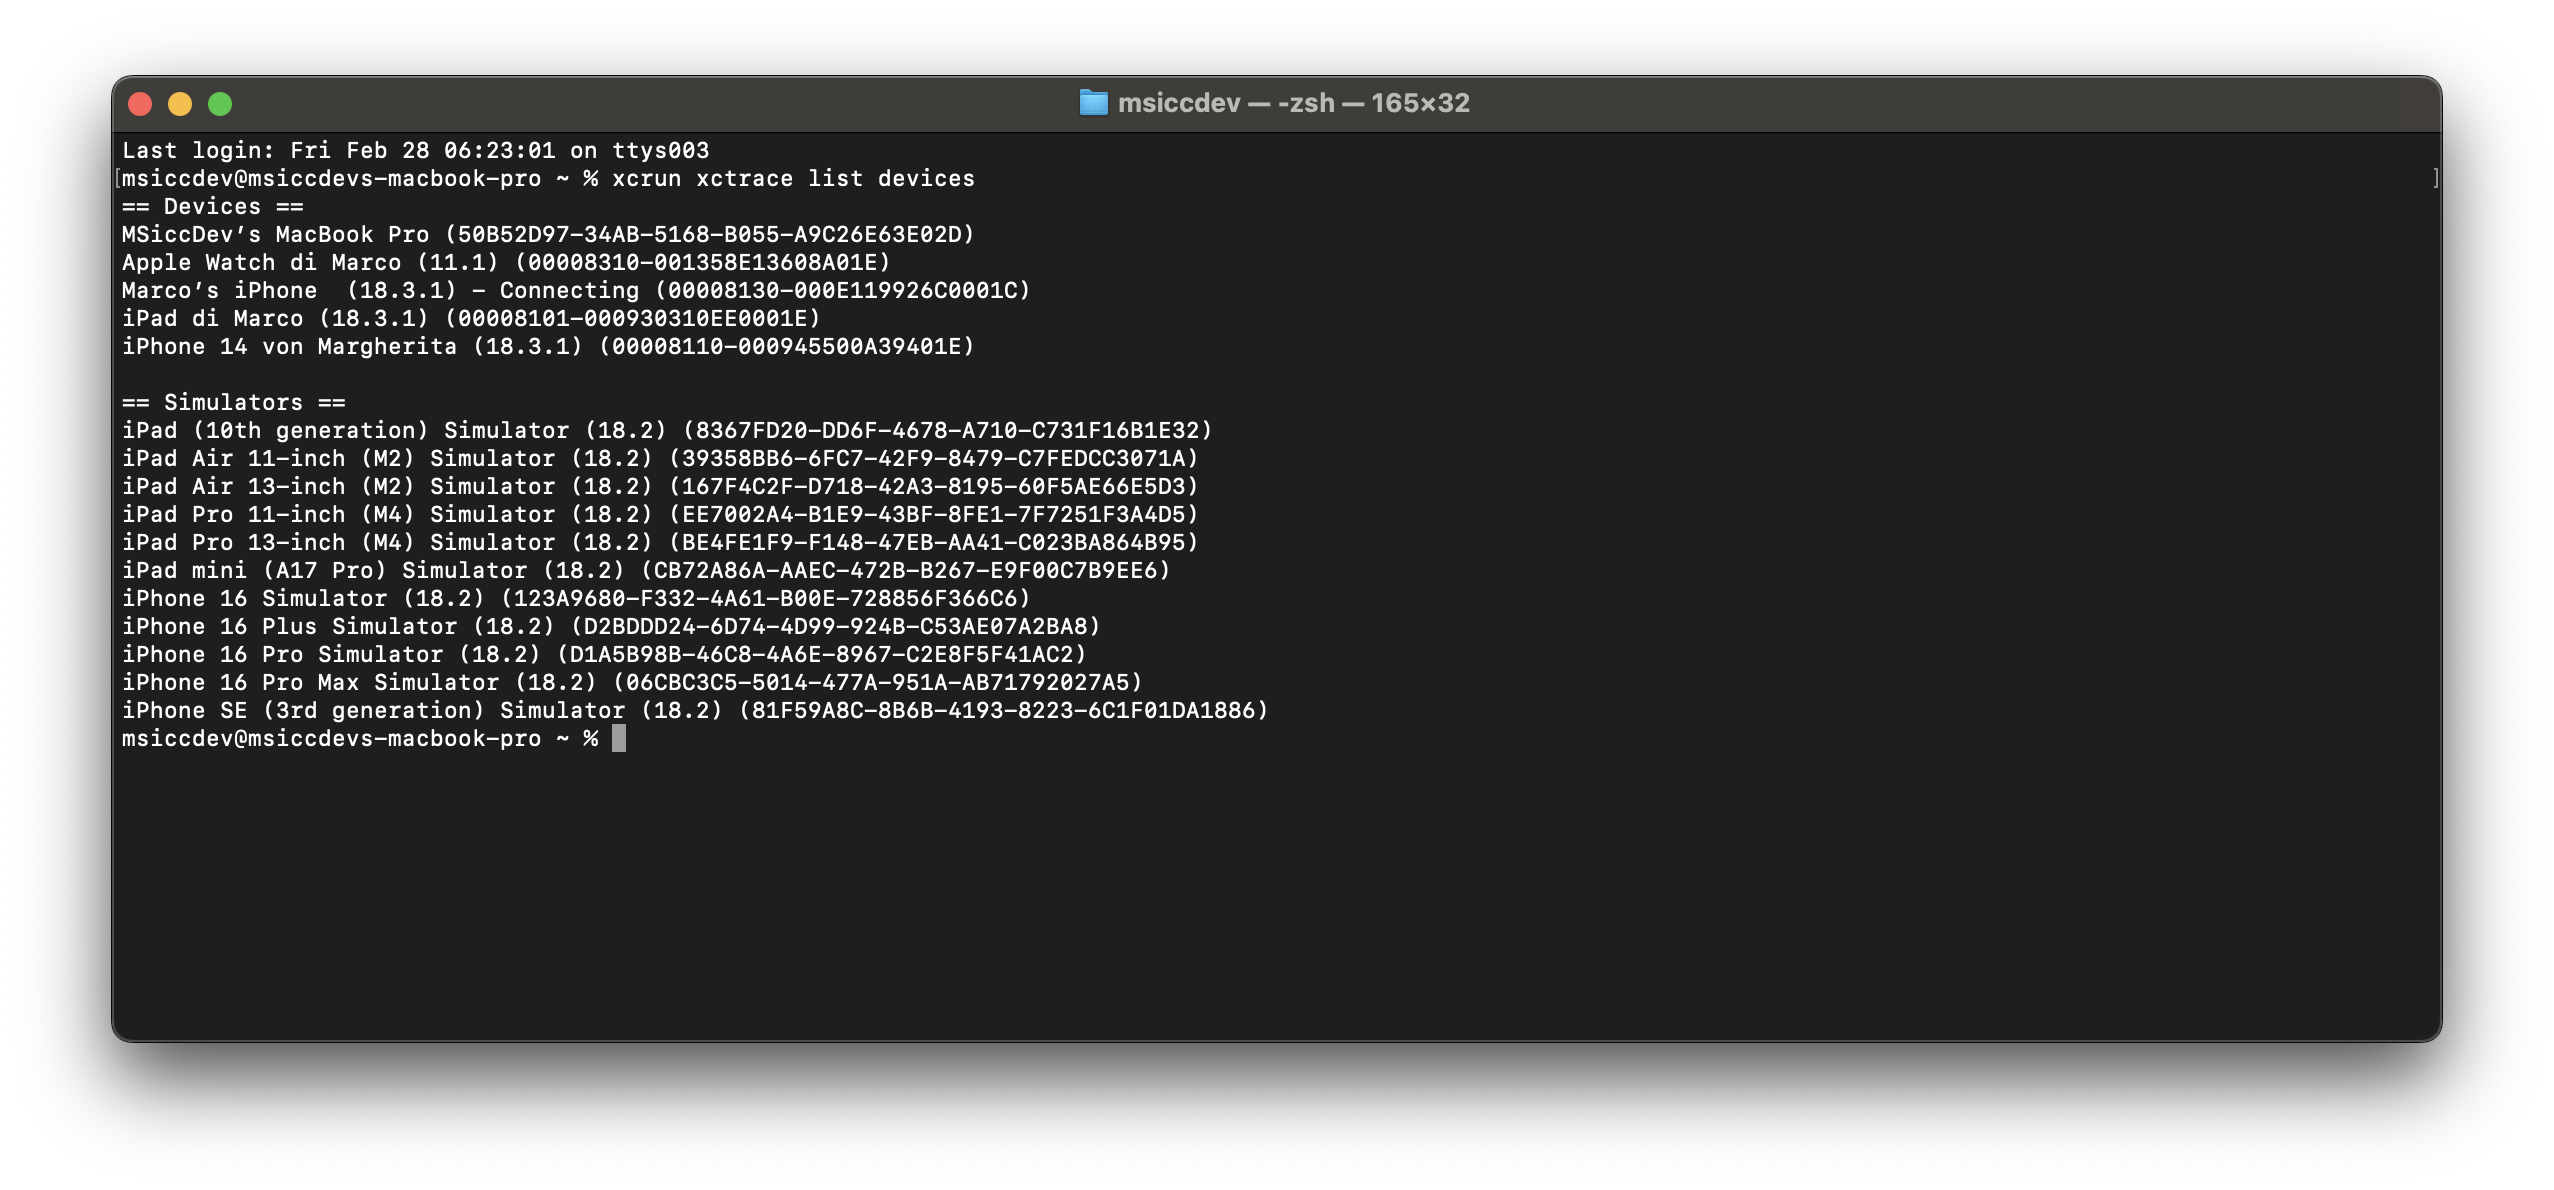
xcrun xctrace list devices
This will show you a list of all devices your mac currently knows. Select the one you’re testing on for the coming two occurences of the mlaunch command.
Now that you know the name of your testing devices, enter the following command:
1
/usr/local/share/dotnet/packs/Microsoft.iOS.Sdk.net9.0_18.2/18.2.9170/tools/bin/mlaunch --installdev [PATH_TO_APP].app --devname [DEVICENAME]
The paths may vary on your machine. If you are not seeing hidden folders in Finder (for the mlauch path), hit CMD+SHIFT+. on your keyboard to show them. Replace the file path to the .app file of your app and the device name as well. In the second terminal window, prepare the trace command, but do not yet start it (do not hit ENTER):
1
dotnet-trace collect --diagnostic-port ~/my-dev-port,connect --format speedscope;
This will collect both a .nettrace file and also provides the trace in the speedscope format.
Now go back to the terminal window where you installed your app. Enter the following command to start the app process and make it wait for the trace collector:
1
/usr/local/share/dotnet/packs/Microsoft.iOS.Sdk.net9.0_18.2/18.2.9170/tools/bin/mlaunch --launchdev [PATH_TO_APP].app --devname [DEVICENAME] --wait-for-exit --argument --connection-mode --argument none '--setenv:DOTNET_DiagnosticPorts=127.0.0.1:9001,suspend,listen'
Once again, replace the file paths and the device name to match yours. Now you have to be fast and fire the prepared dotnet-trace command in the third terminal window. It should look like this:
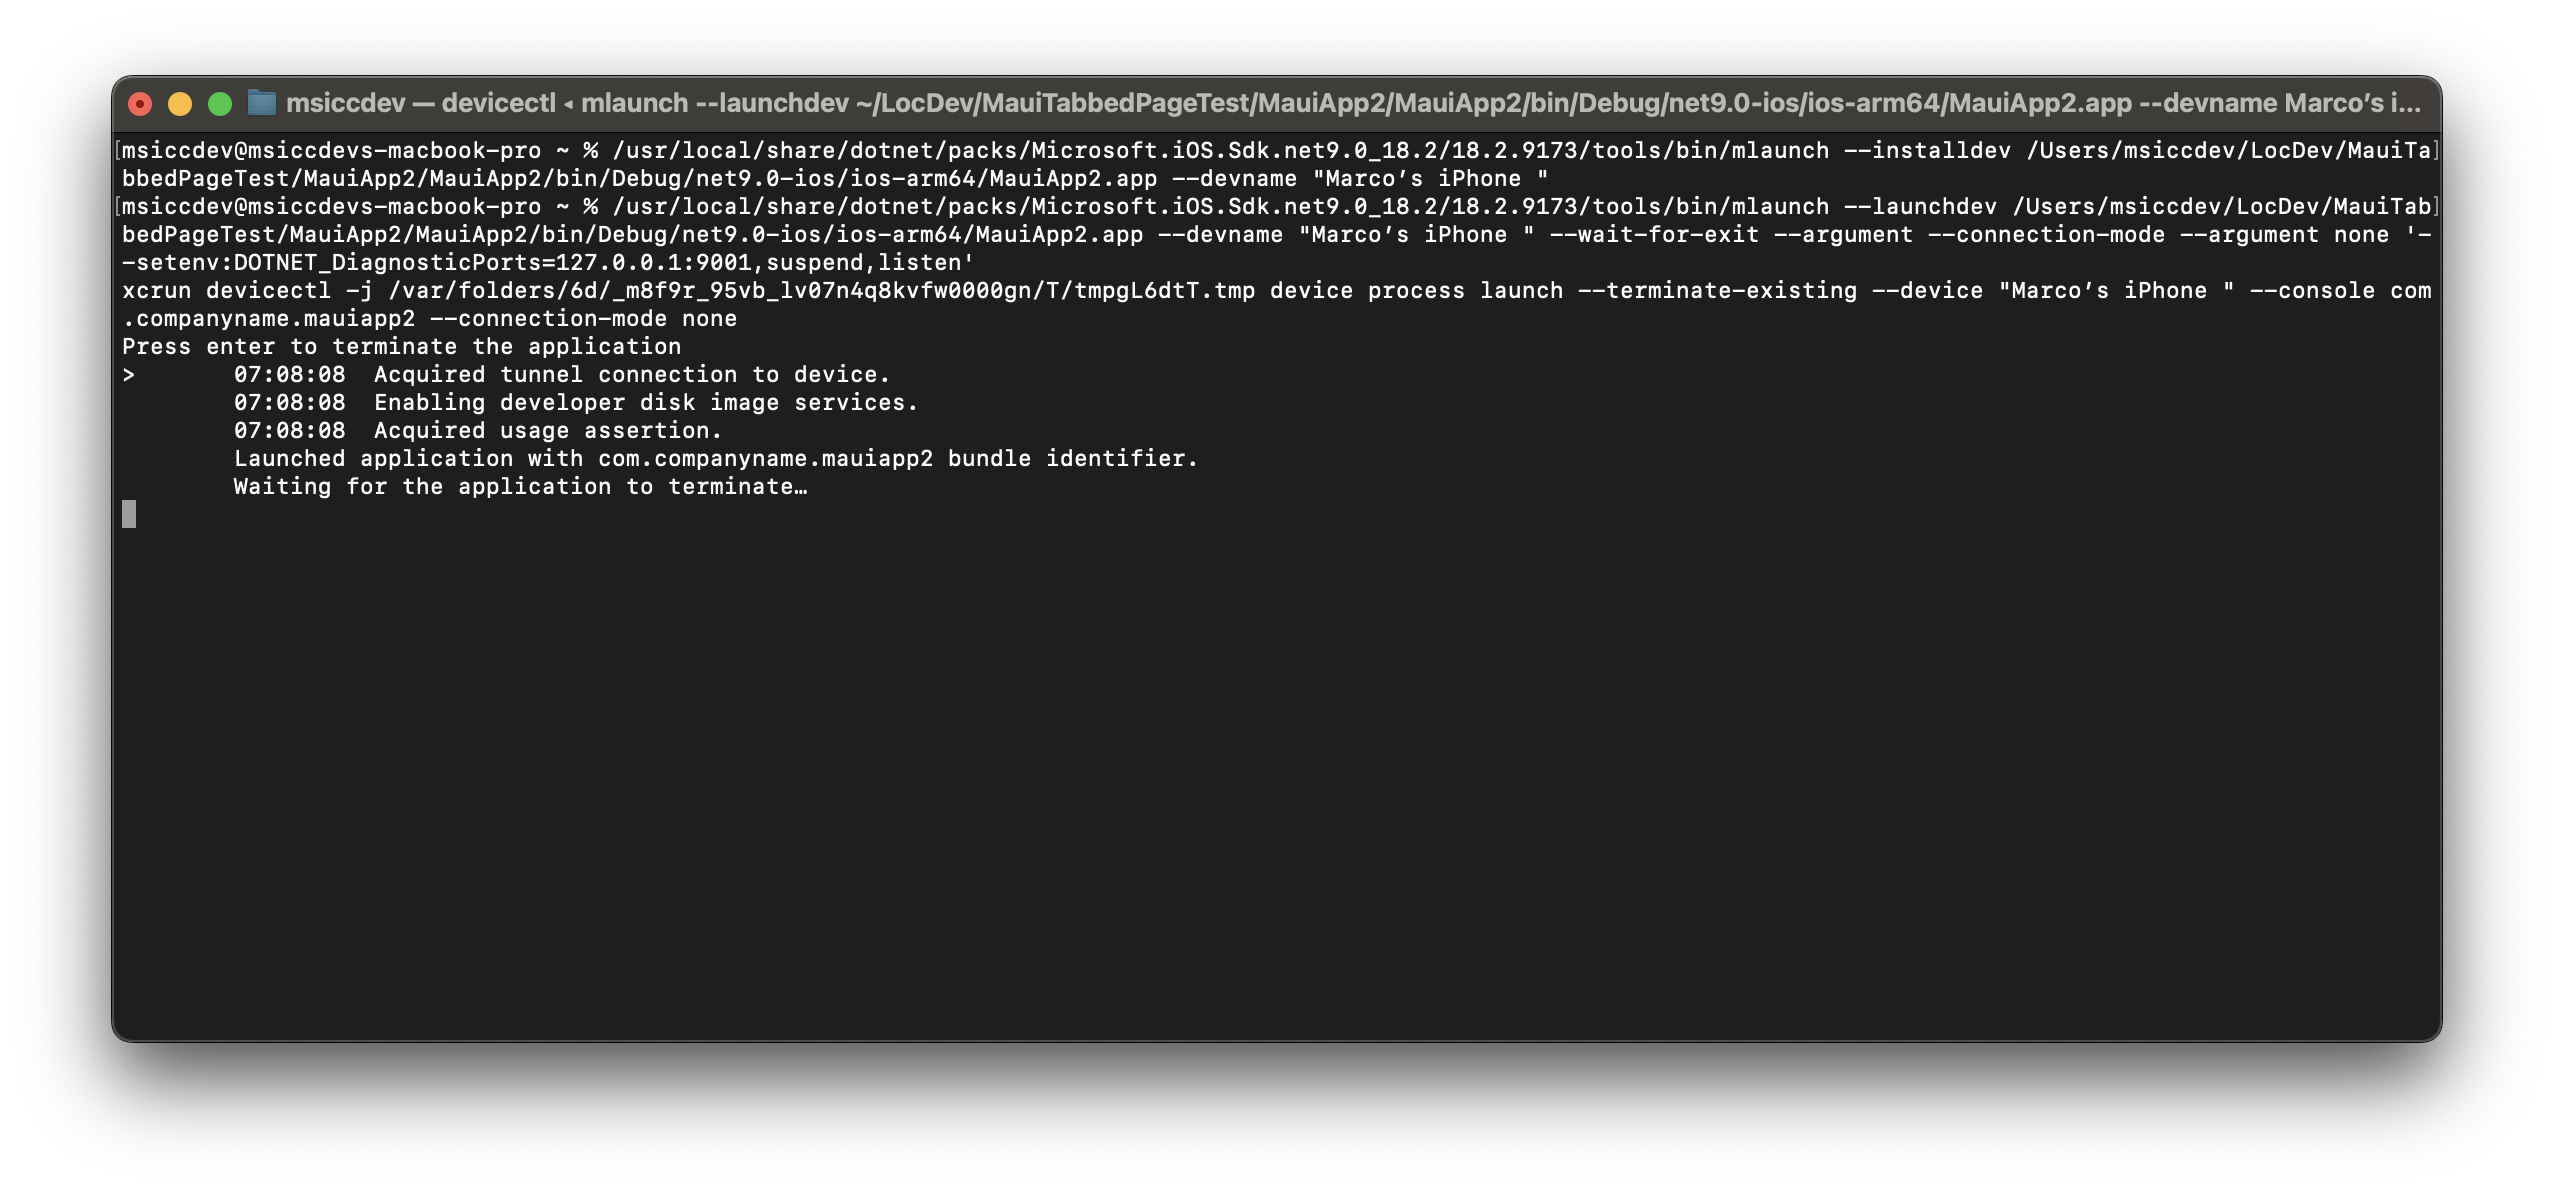
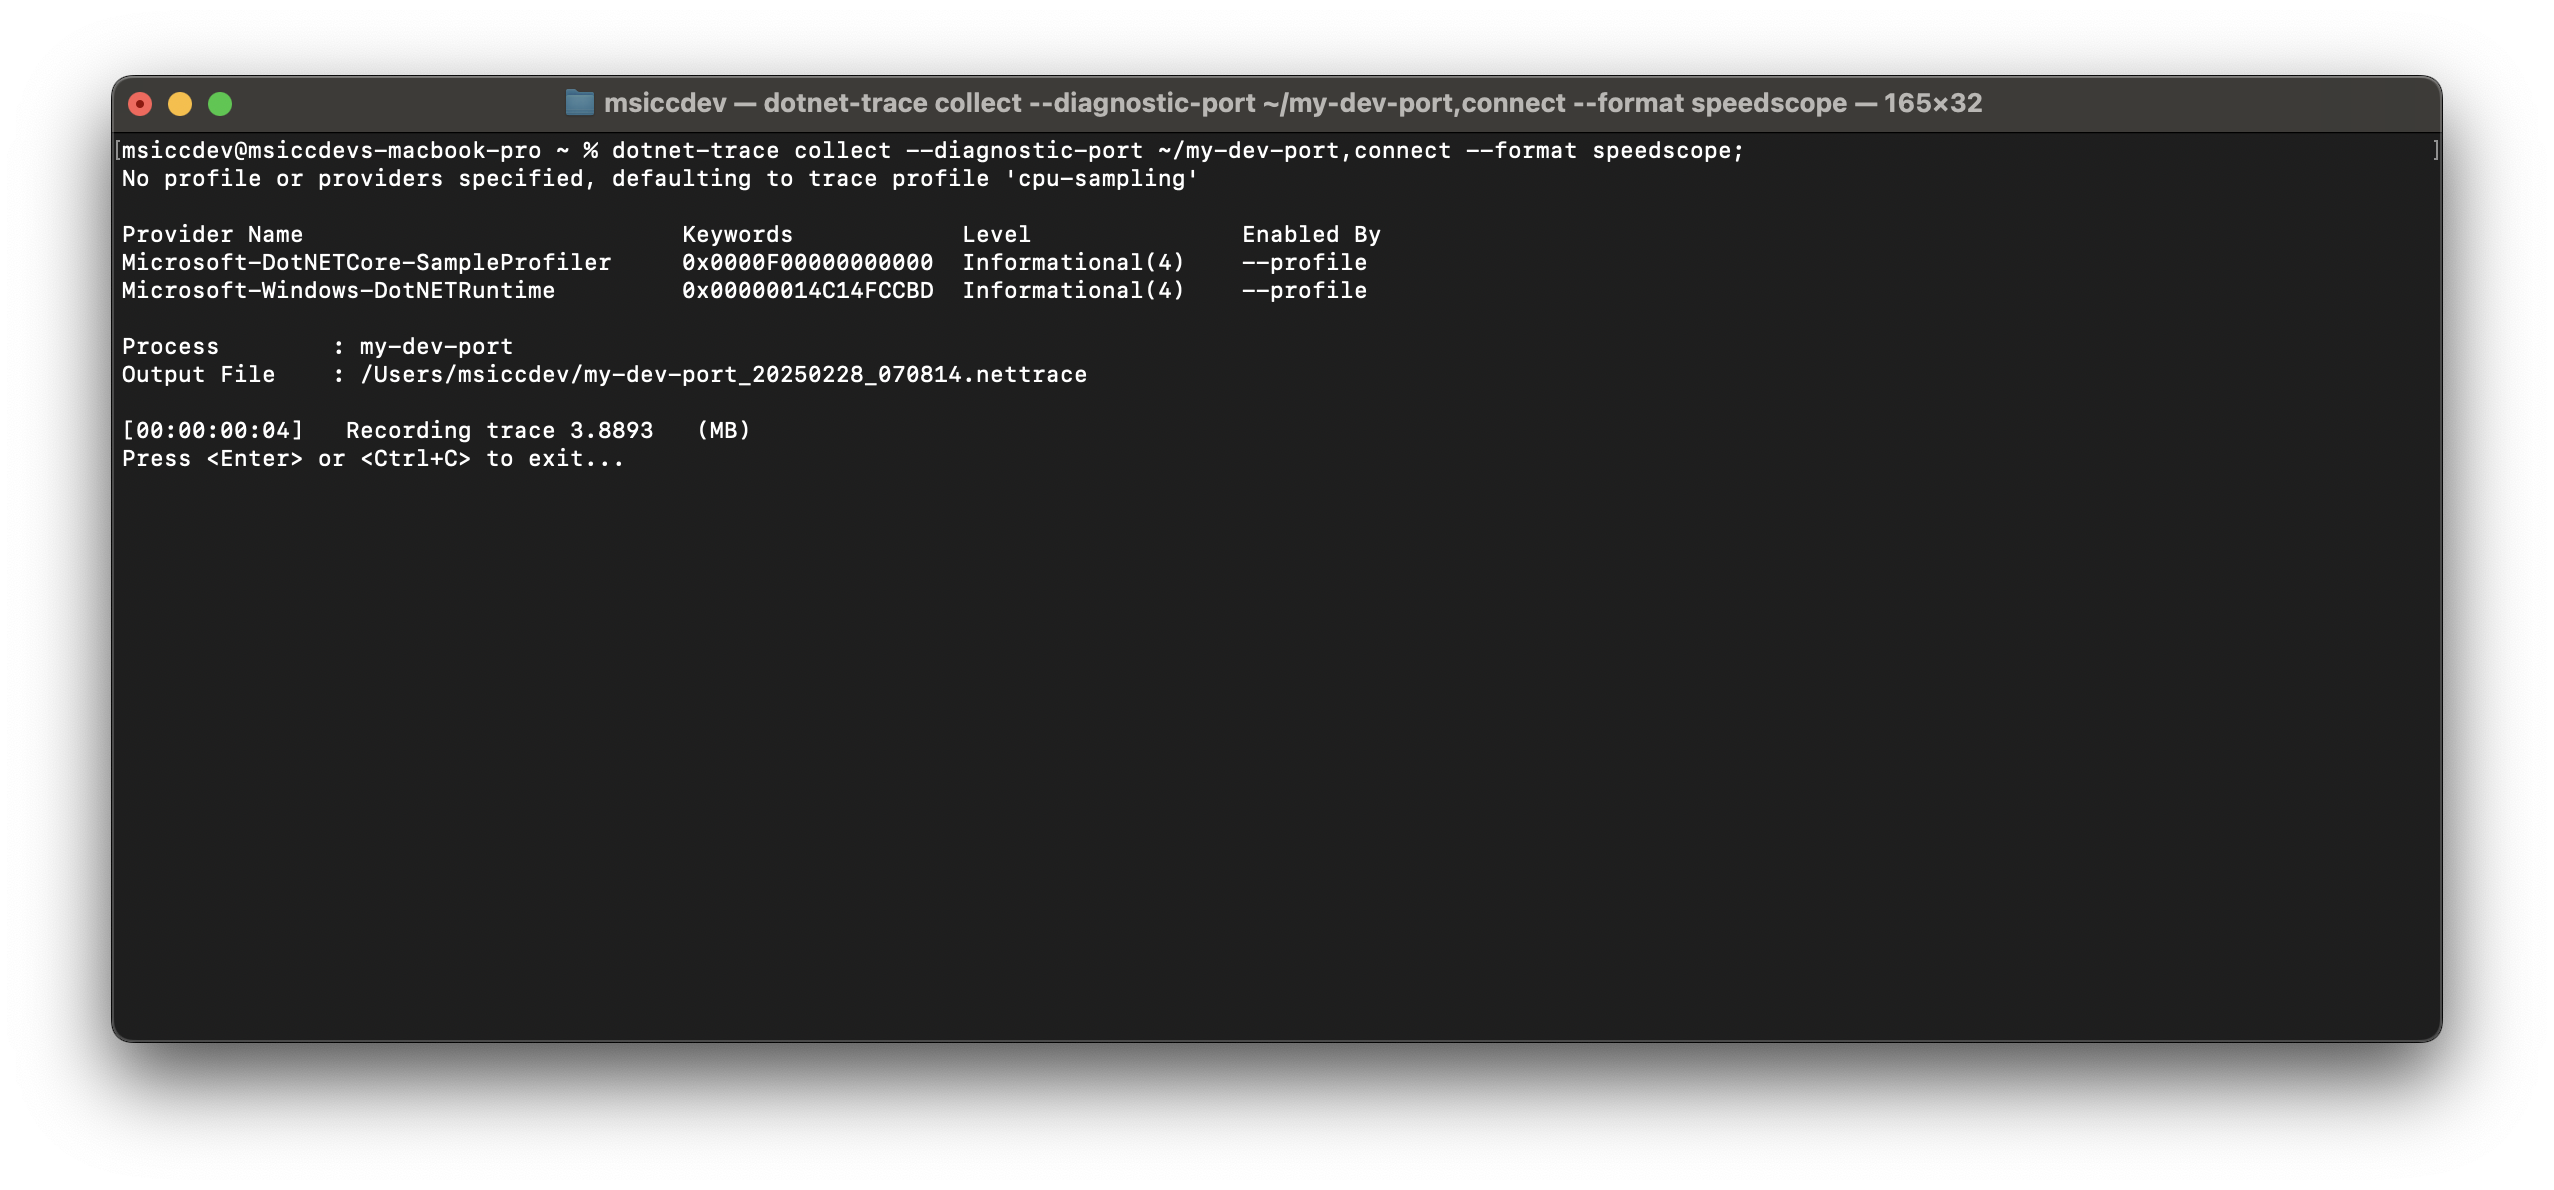
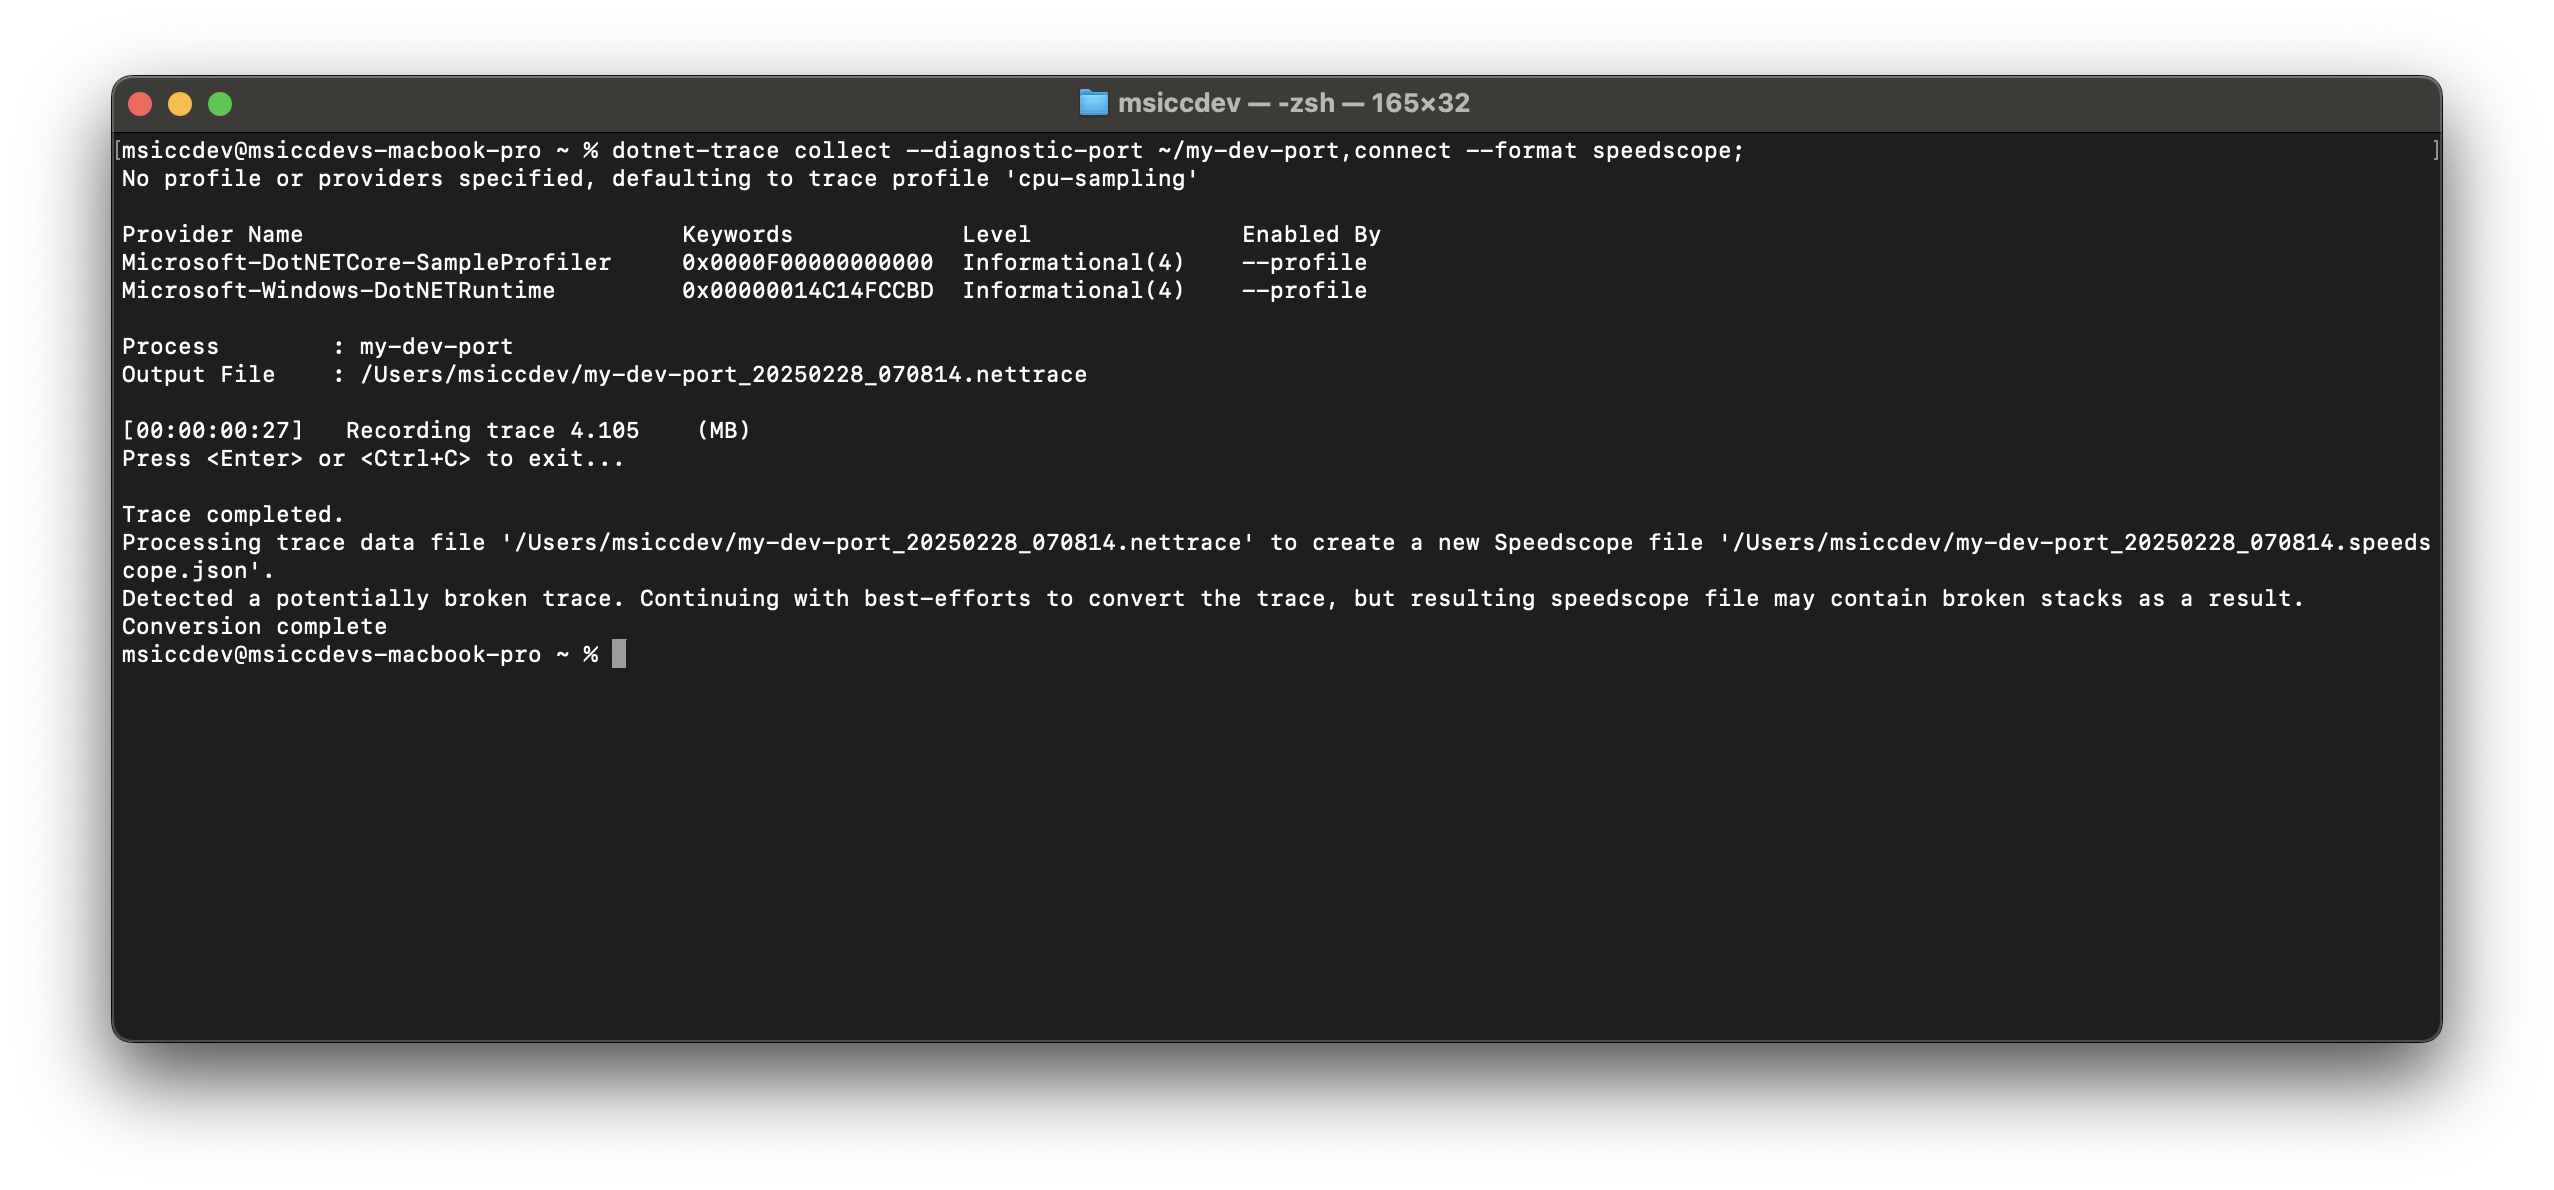
The app should run on your device. The second window will show the typical debug output. You can finish the process of tracing by closing the app or hitting CTRL+C on your keyboard. Once that happened, you will be presented with the file paths to both the .nettrace file and the speedscope.json file.
Analyse the resulting trace files
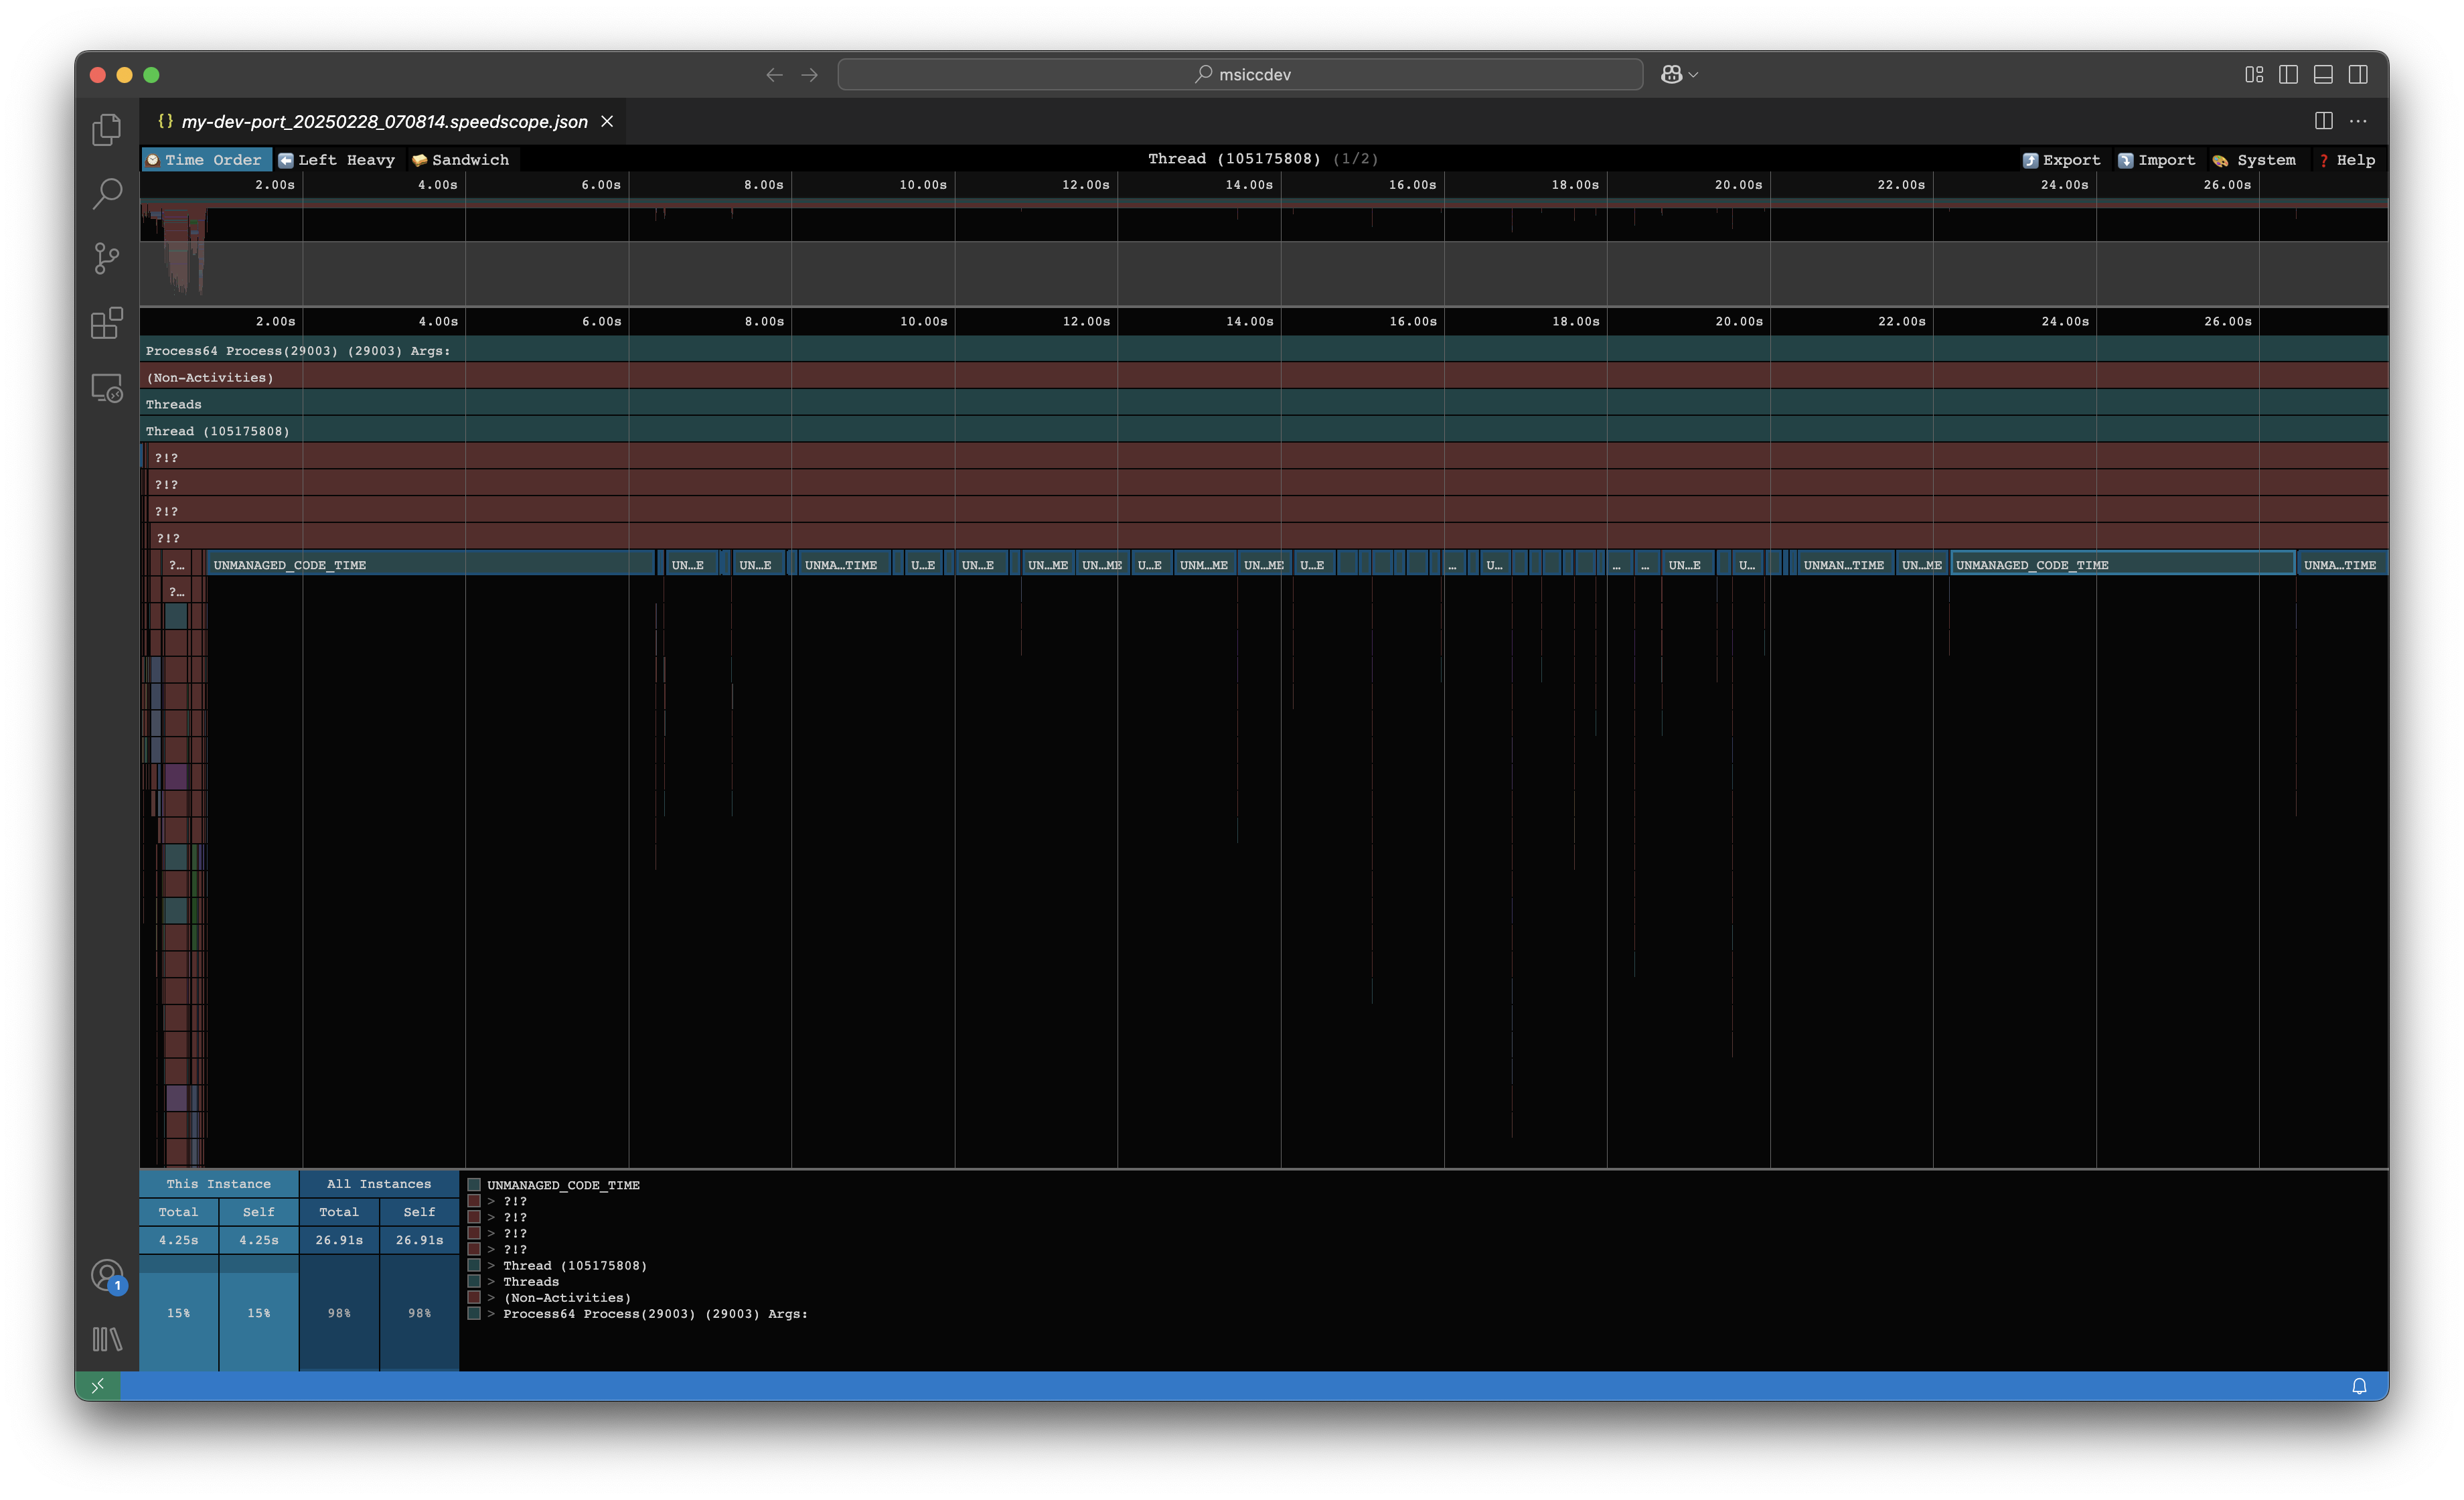
If you prefer the speedscope format, you can install this extension into VSCode for analyzing the file.
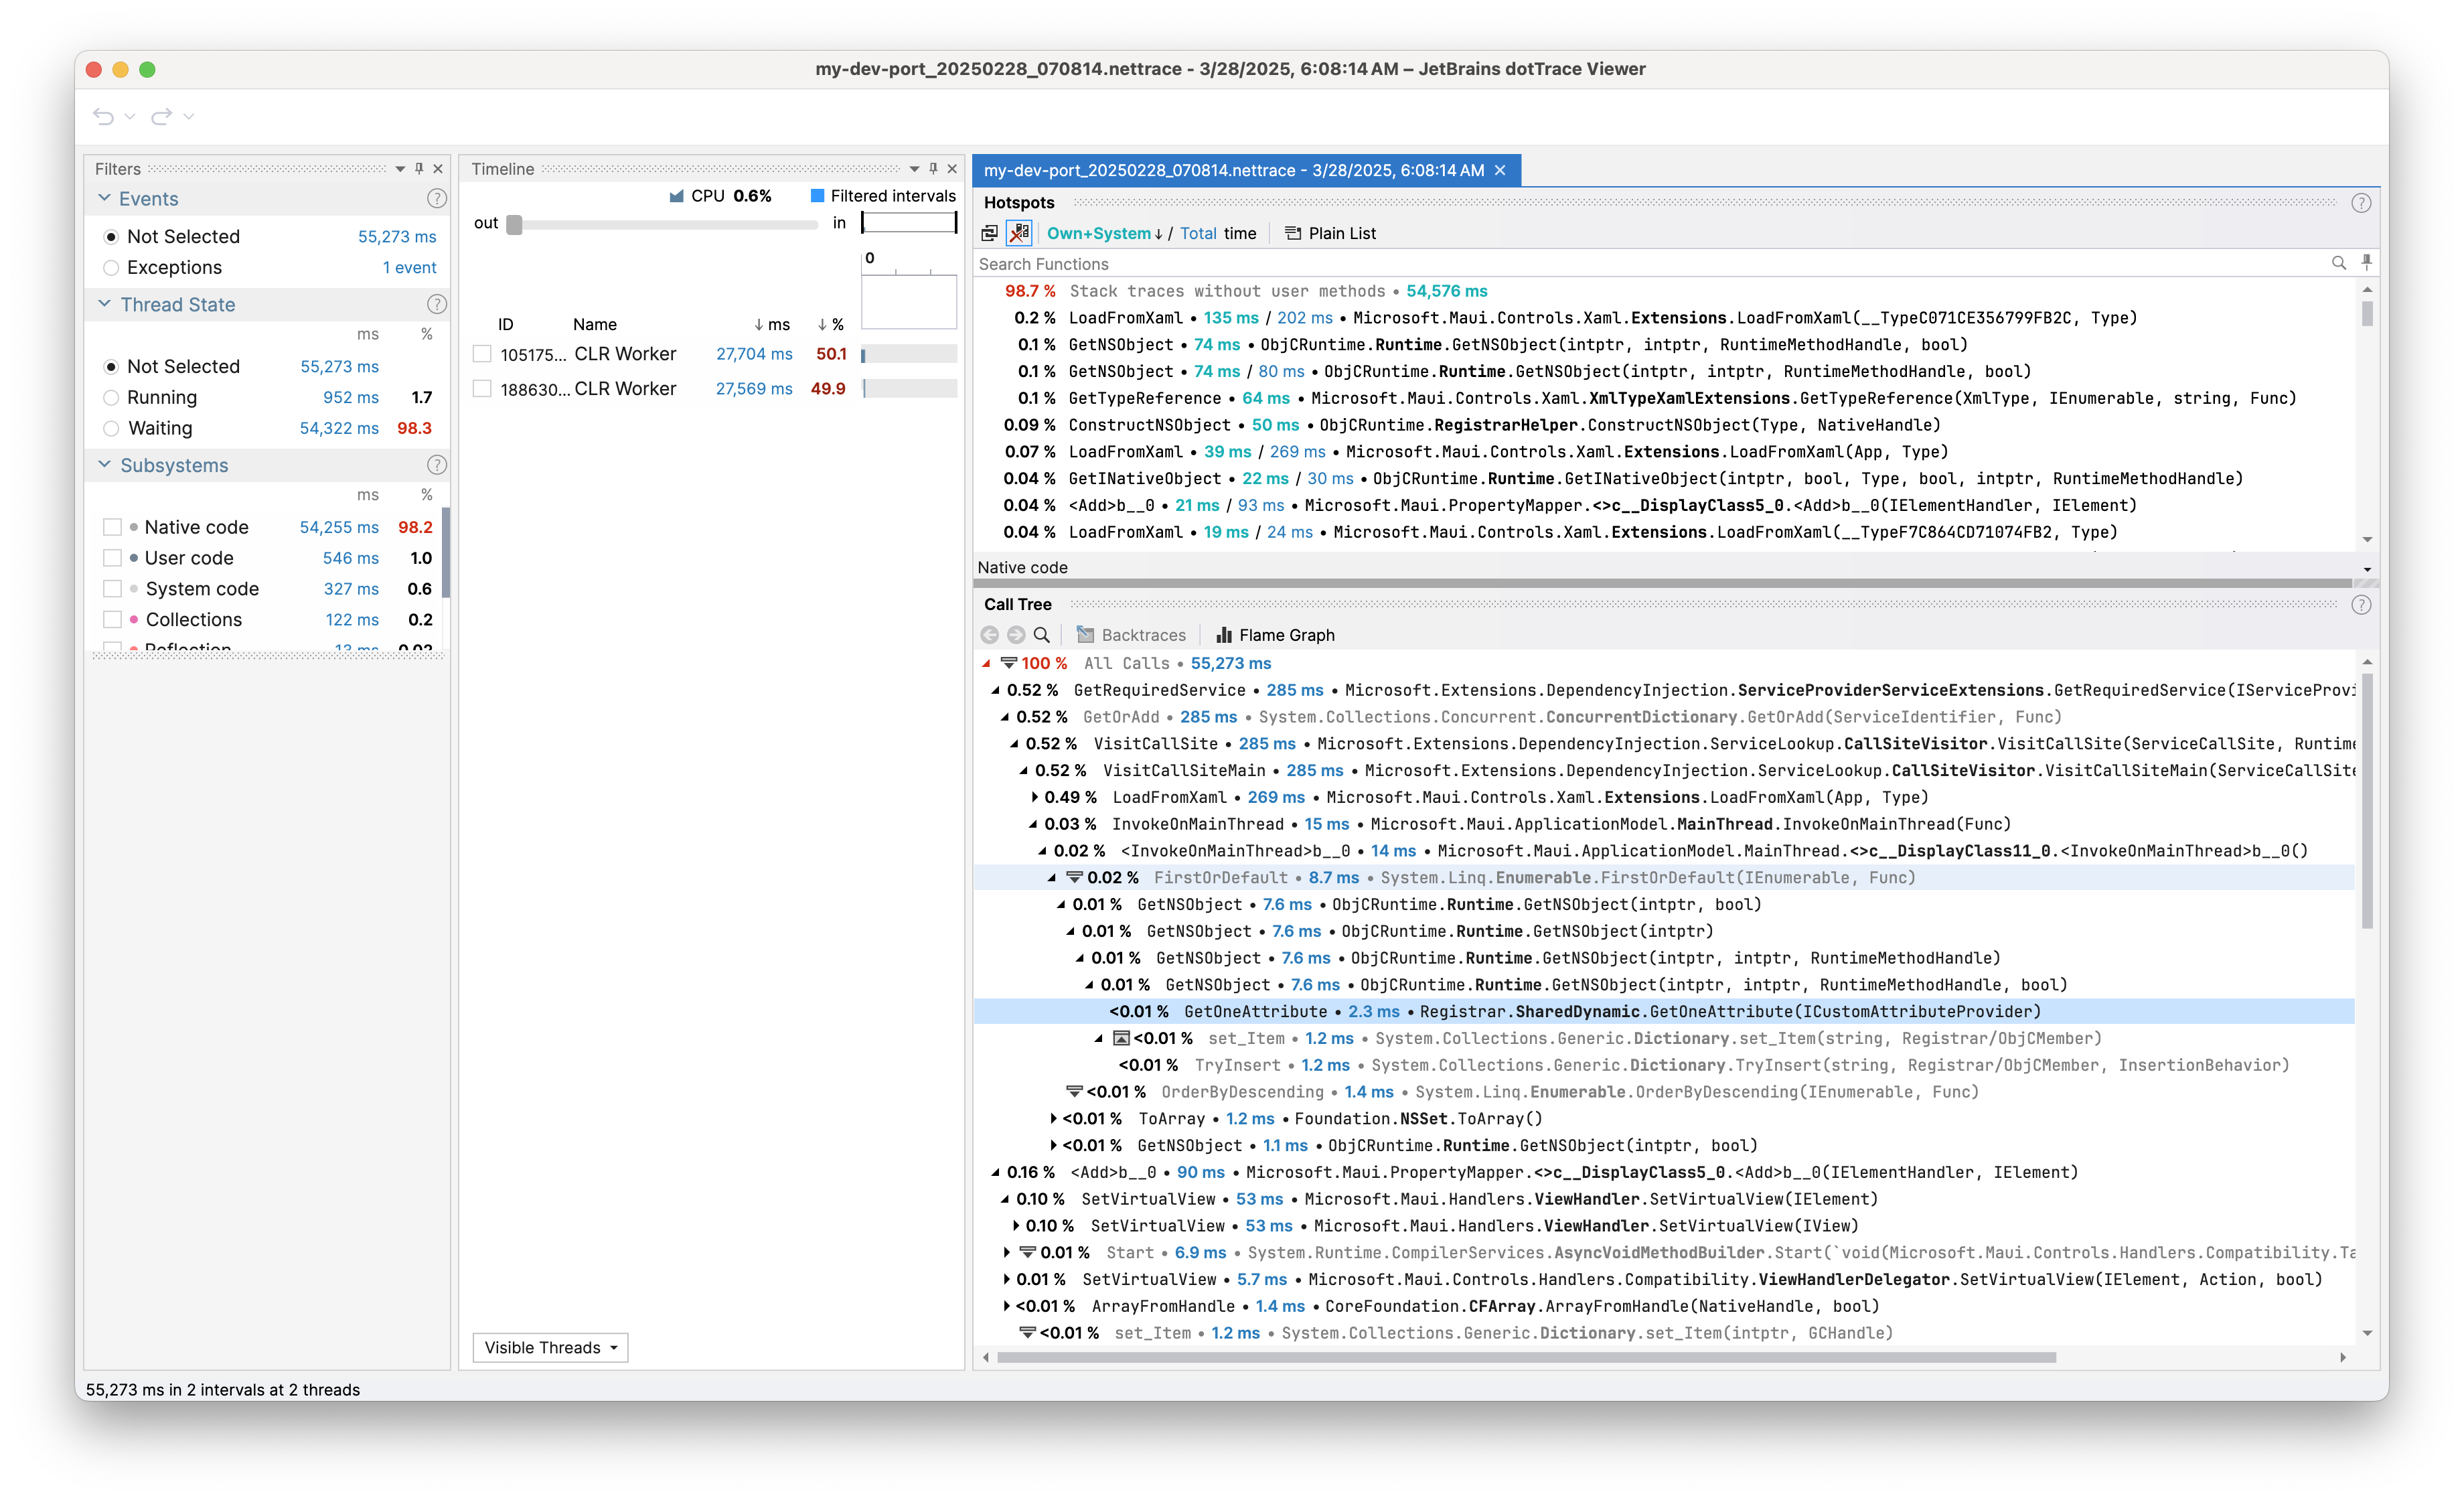
For analysing the .nettrace file, just open the file in dotTrace (download here) as Snapshot. Analysing the .nettrace file is usually more helpful than the speedscope file. If you want to learn how to read the snaphot, the JetBrains documentation is a good starting point.
As always, I hope this post will be helpful for some of you.
Until the next post, happy coding, everyone!
Disclaimer: the title image of this blog post is generated with AI (ChatGPT 4.o)